Google Street View
Dataset About Google Street View dataWe utilized Google’s Street View Image API to collect image data from Chicago, Illinois; Charleston, West Virginia; and Salt Lake City, Utah between December 2016-February 2017. Details on data collection and image processing are included in a separate data dictionary. This dataset provides zip code and census tract summarized data for the following neighborhood characteristics: 1) street greenness/landscaping (street trees and street landscaping comprised at least 30% of the image; yes/no), 2) building type (single-family detached house vs. other), and 3) presence of crosswalks (yes/no).
For each zip code, the following was calculated: percentage of street images with A) presence of a crosswalk, B) building type other than a single-family detached house, and C) street landscaping comprising at least 30% of the image. Neighborhood characteristics were categorized into tertiles and spatially mapped. Darker colors represent higher tertile values. Data source: Google Street View Images.
Figures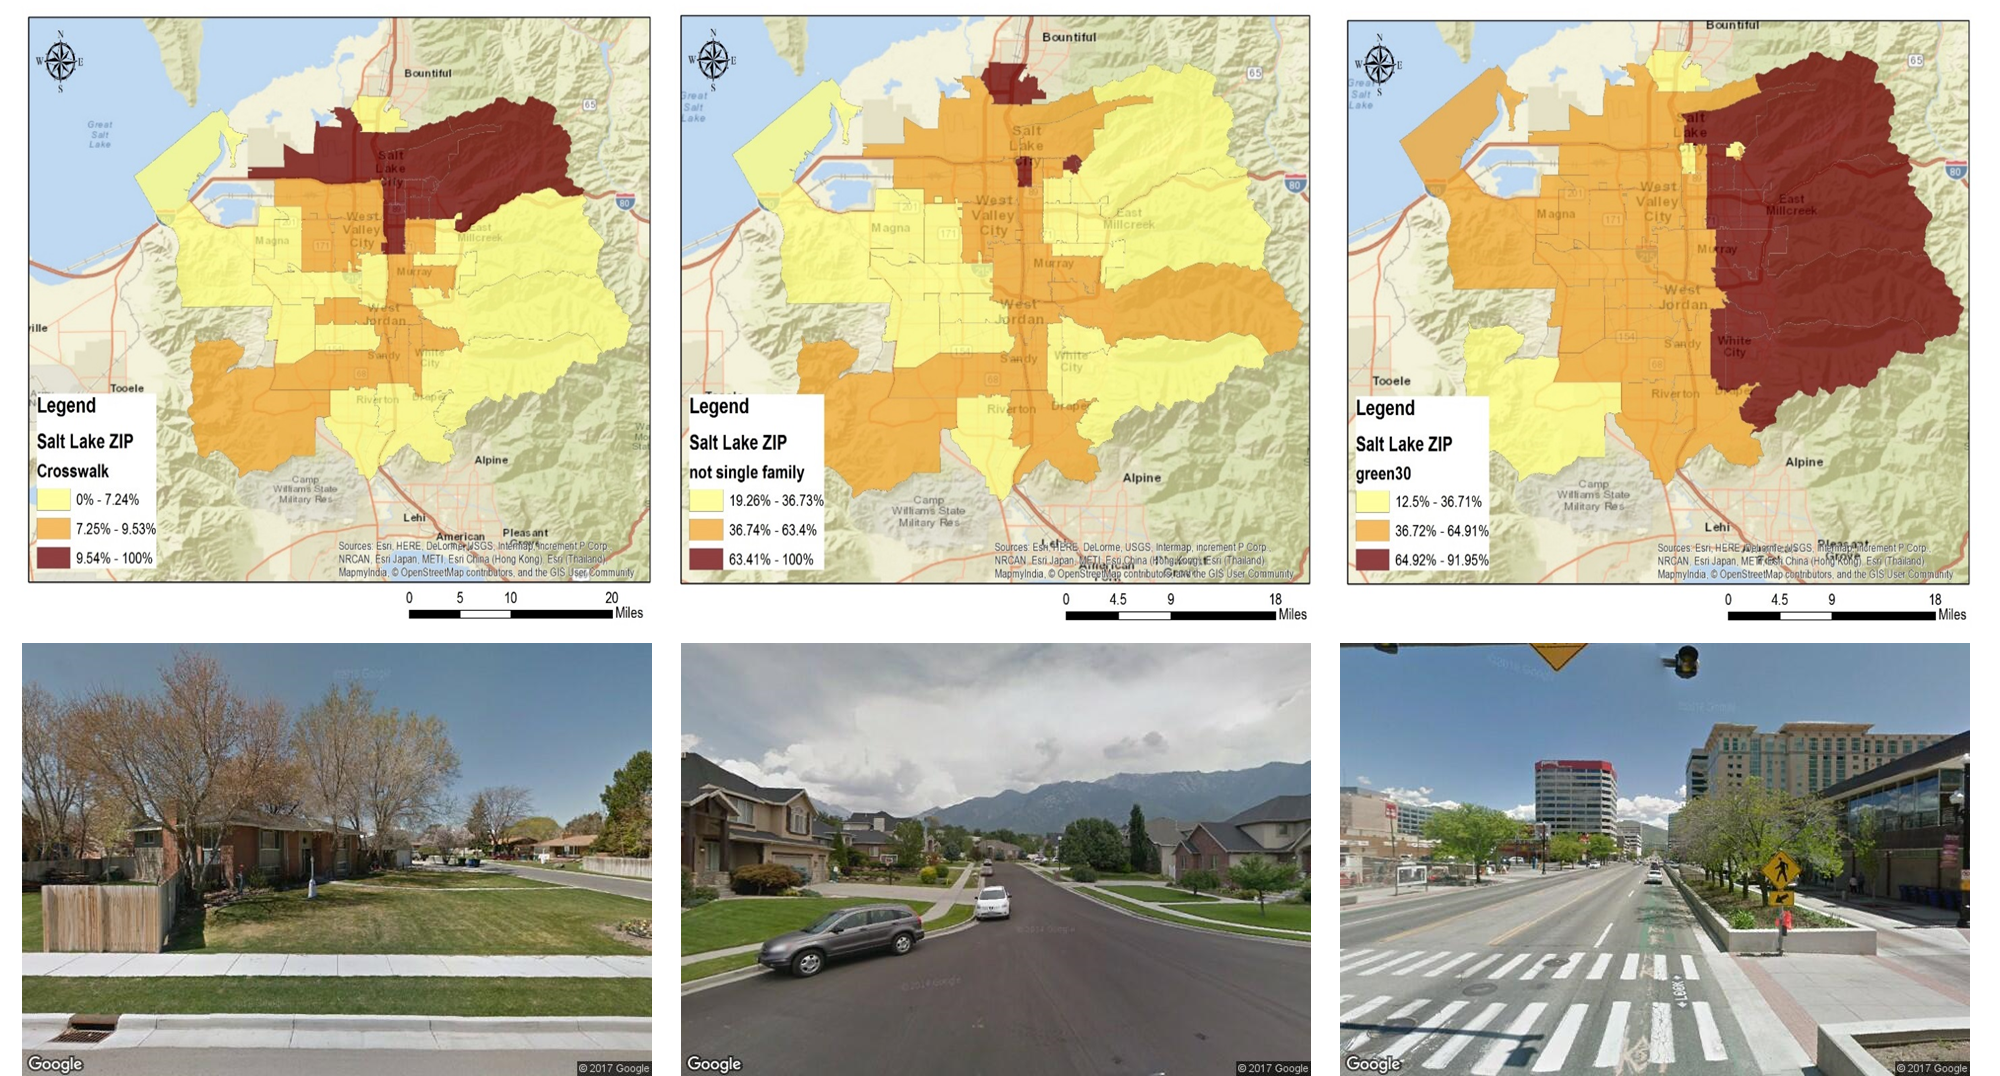 Figure 1. Zip code distribution of built environment characteristics in Salt Lake City, Utah
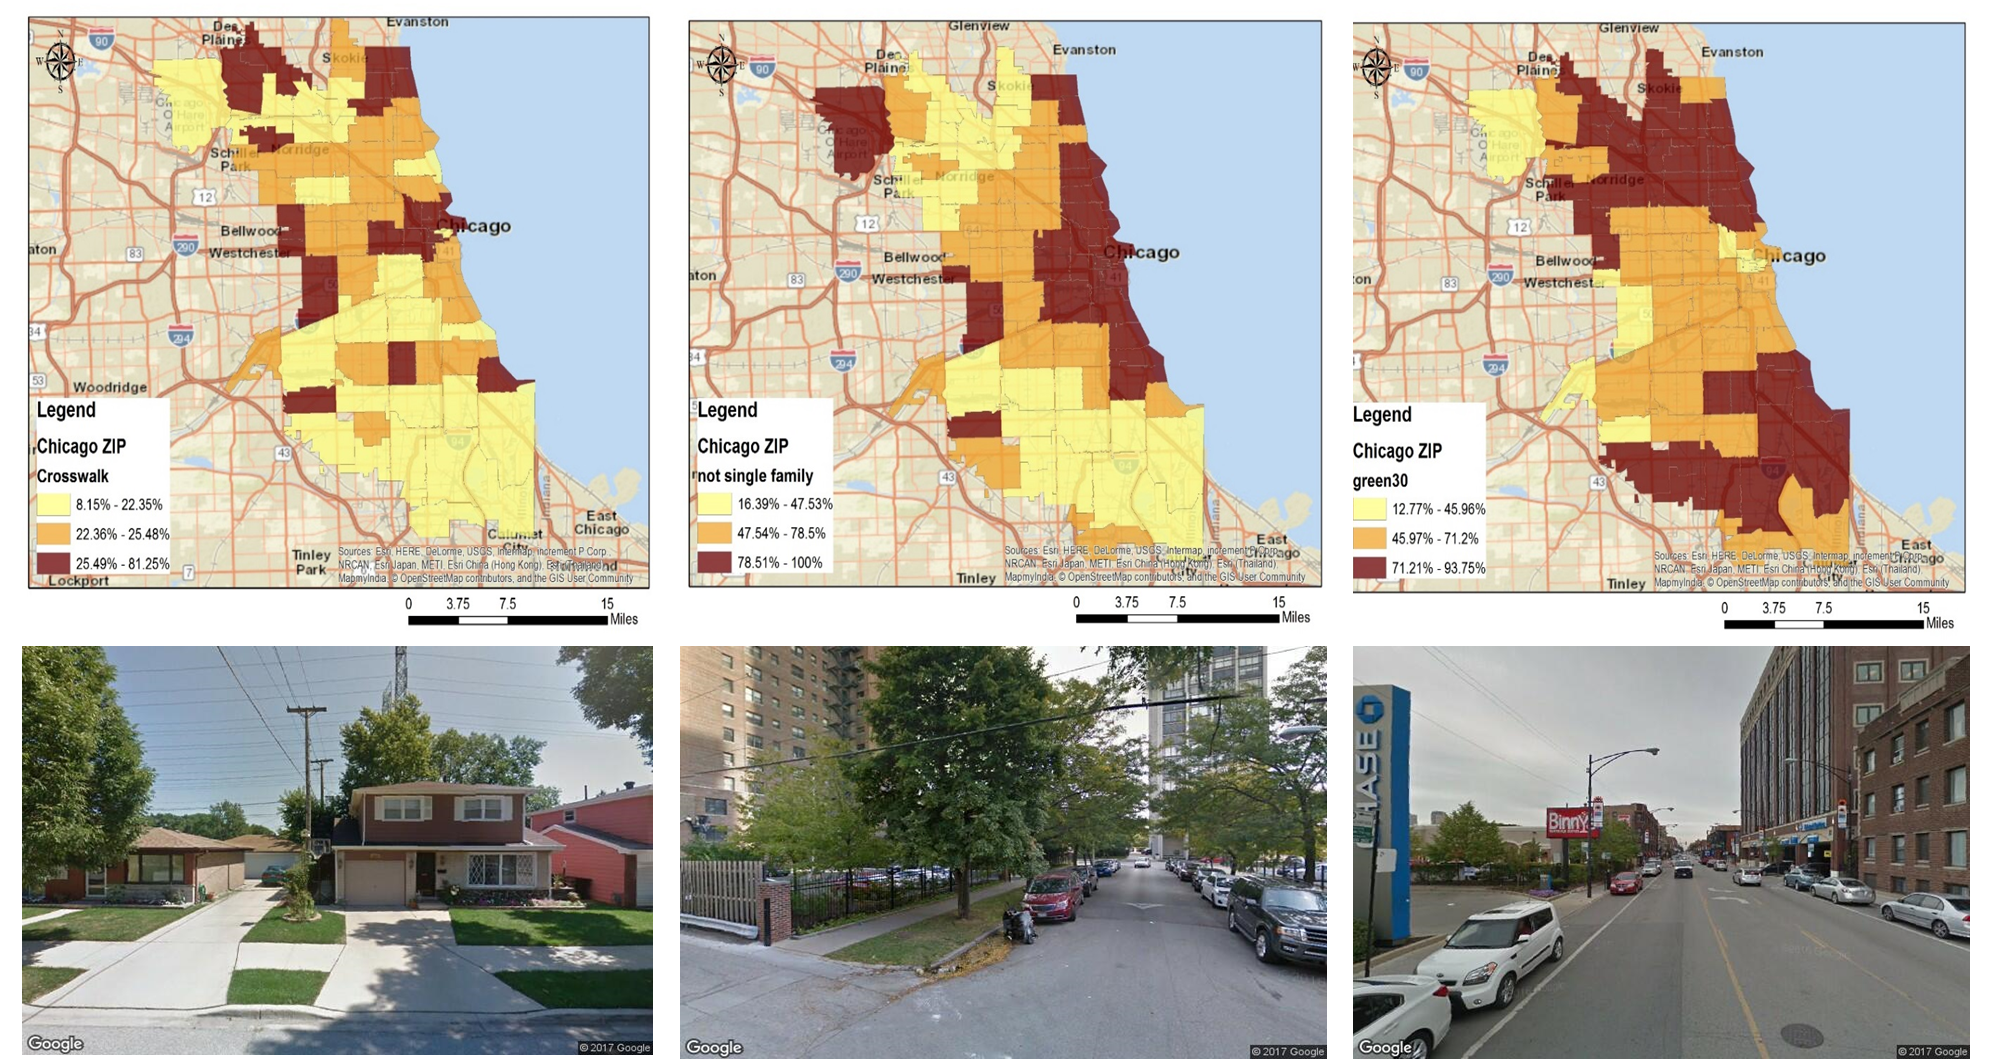 Figure 2. Zip code distribution of built environment characteristics in Chicago, Illinois
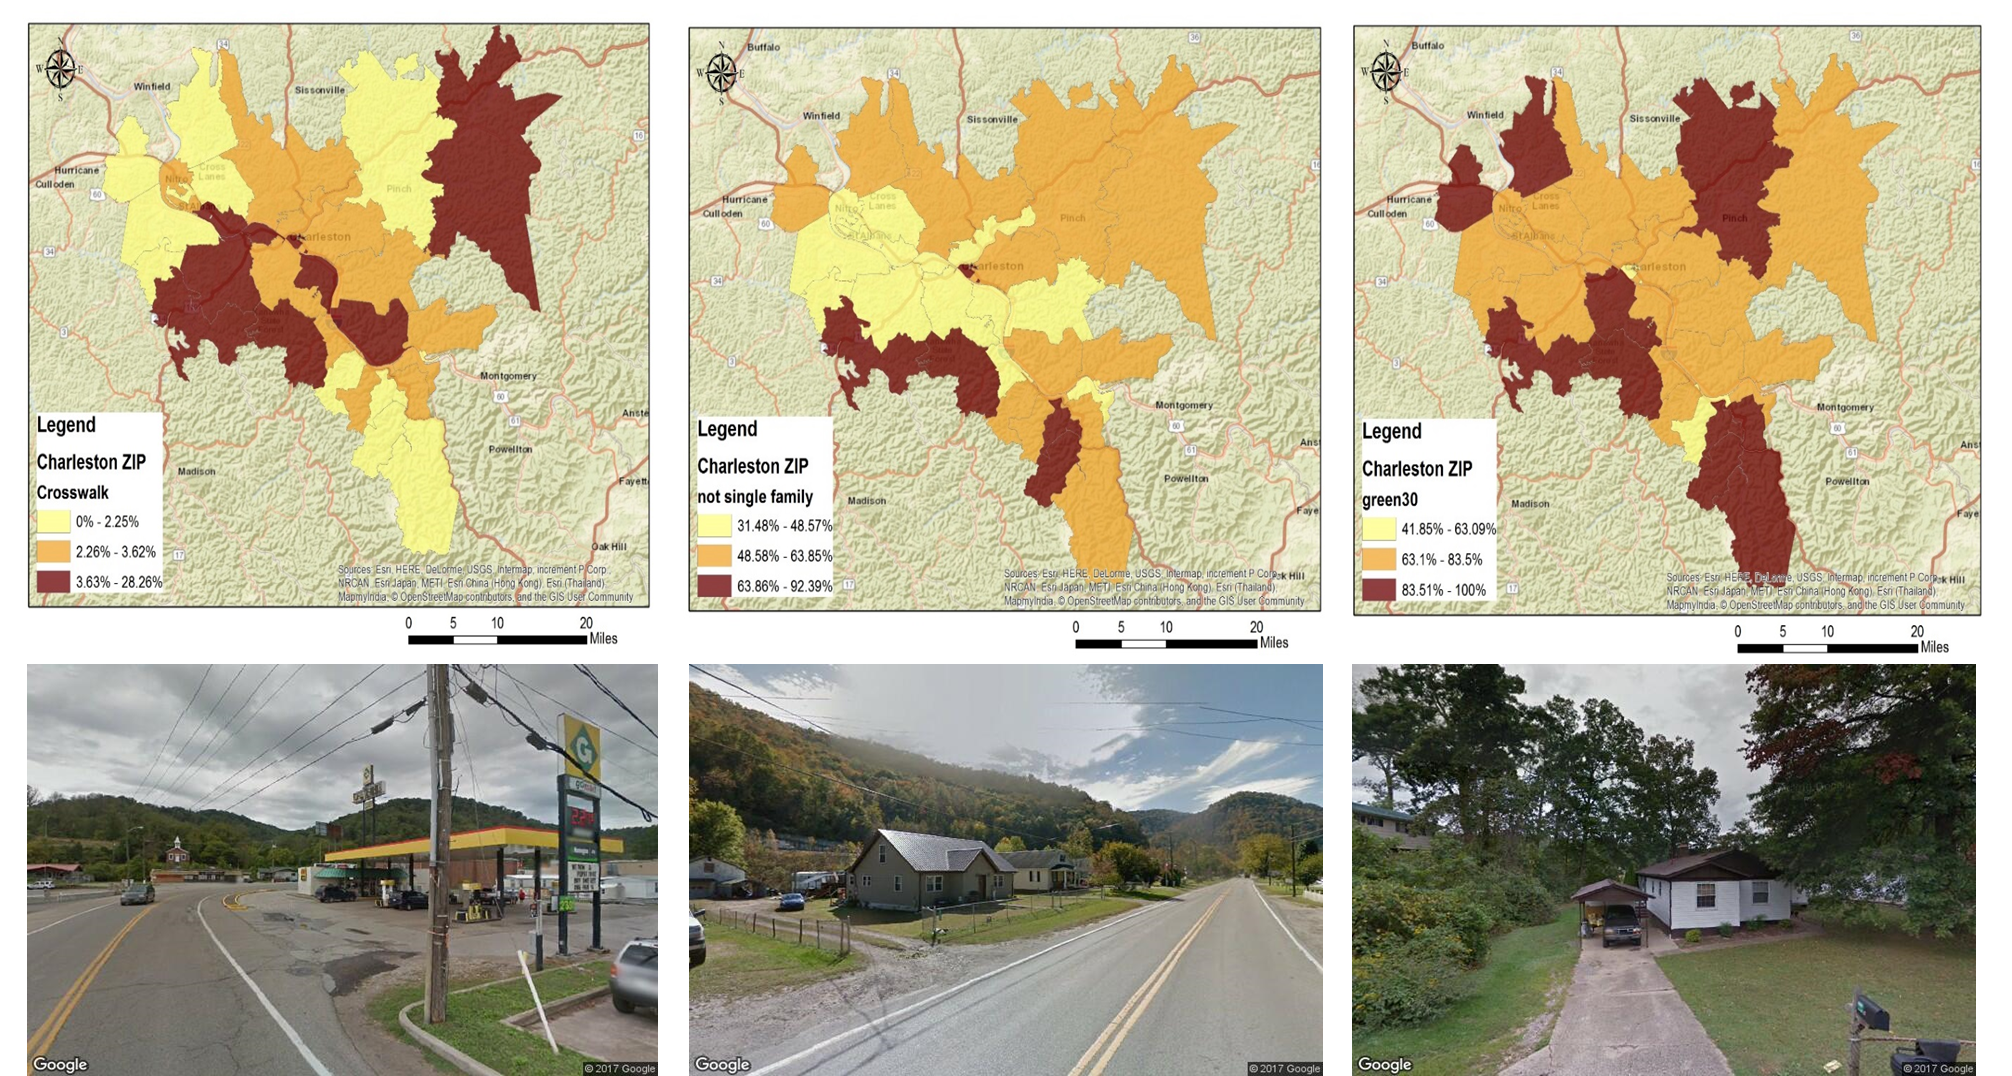 Figure 3. Zip code distribution of built environment characteristics in Charleston, West Virginia